WHITE PAPER: ICE Vehicles Show 6 Times Higher Fire Incidence Than EVs in Propulsion-Separated Data
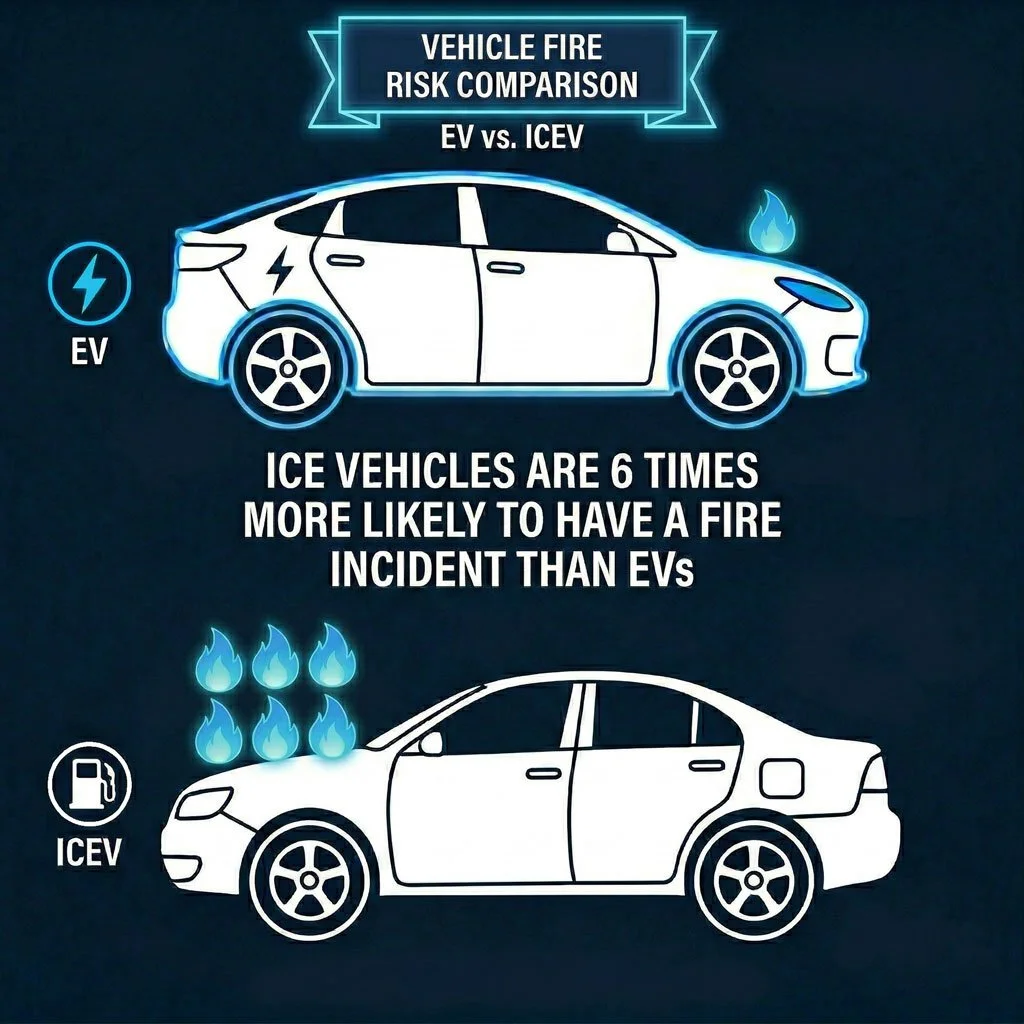
Internal combustion engine (ICE) vehicles are approximately six times more likely to experience a vehicle fire than battery-electric vehicles (EVs) on a per-registered-vehicle basis in propulsion-separated national datasets.¹
This ratio is derived from Norwegian Directorate for Civil Protection data indicating approximately 30 ICE vehicle fires per 100,000 registered vehicles annually compared to approximately 5 EV fires per 100,000 vehicles.¹
Executive Summary
HOA boards evaluating right-to-charge laws frequently ask whether permitting EV charging introduces additional or unaccounted fire risk in enclosed parking garages.
Available empirical evidence indicates:
EVs do not have a higher ignition probability than ICE vehicles.¹ ²
In propulsion-separated datasets, ICE vehicles exhibit materially higher fire incidence.¹ ²
Modern EVs incorporate advanced battery monitoring and crash-isolation safeguards mandated by safety standards.³ ⁴
Garage fire risk is governed primarily by building fire protection systems, not propulsion type.⁵ ⁶
Supporting right-to-charge statutes does not introduce disproportionate fire probability when installations comply with applicable electrical and fire codes.
Statistical Probability of Vehicle Fire
Propulsion-Separated National Data
Norwegian Directorate for Civil Protection (DSB) statistics (2018–2022 average):¹
ICE vehicles: ~30 fires per 100,000 vehicles
EVs: ~5 fires per 100,000 vehicles
This yields a relative risk ratio of approximately 6:1.¹
Swedish Civil Contingencies Agency (MSB) data similarly indicate that EV fire incidence remains materially lower than gasoline and diesel fleets.²
These propulsion-separated datasets provide the clearest comparative statistical framework currently available.
United States Context
The National Fire Protection Association estimates approximately 195,927 highway vehicle fires annually in the United States (2018–2022 average), aggregating all propulsion types.⁵
While U.S. national reporting does not yet consistently disaggregate EV and ICE categories, insurance loss data from the Highway Loss Data Institute show non-crash fire claim frequencies for EVs comparable to or lower than conventional vehicles.⁷
International datasets therefore provide the most reliable quantitative contrast at present.
Interpreting the Asymmetry
The six-fold difference in fire probability is structurally analogous to other statistically asymmetric risks that are frequently misunderstood.
Commercial aviation, for example, is statistically safer than automobile travel despite higher visibility of rare catastrophic events.
Similarly, EV fires receive disproportionate media attention because of battery involvement, even though measured ignition probability remains materially lower than that of conventional fuel-powered vehicles.¹ ²
The statistical asymmetry favors EVs.
Mechanisms of Fire
Internal Combustion Engine Vehicles
ICE vehicles contain 10–20 gallons of flammable liquid fuel. Common ignition pathways include:
Fuel system leaks
Electrical short circuits
Engine compartment overheating
Post-collision fuel spillage
Fuel system integrity requirements such as FMVSS 301 are specifically designed to reduce post-crash fire risk from fuel leakage.⁸
NFPA highway vehicle fire data show that flammable liquids and engine-related electrical components are dominant ignition contributors in aggregate U.S. vehicle fires.⁵
Electric Vehicles
EV fires typically involve lithium-ion battery cell failure leading to thermal runaway.⁹
Distinct characteristics include:
Potential for delayed ignition after severe mechanical damage
Extended cooling requirements
Risk of re-ignition due to residual stored energy⁹
However, modern EVs incorporate multiple engineered safeguards:
Continuous battery temperature and voltage monitoring (Battery Management Systems)
Cell segmentation and protective fusing
Structural underbody protection
Crash-activated high-voltage disconnects
Active thermal management systems
These features are governed by regulatory frameworks including FMVSS 305 and UNECE Regulation 100.³ ⁴
Full-scale experiments comparing EV and ICE vehicle fires show comparable total heat release values, indicating that overall fire load is not fundamentally greater for EVs.⁶
Multi-Family Garage Risk Factors
For HOA boards, vehicle fire risk in enclosed garages is influenced primarily by building-level protections rather than propulsion type.
Key determinants include:
Automatic sprinkler coverage per NFPA 13⁶
Smoke control and ventilation performance⁵
Vehicle spacing density
Fire-rated separation between garage and residential occupancies
Code-compliant electrical installation of EV charging equipment
European Commission fire safety guidance for covered parking emphasizes building-level mitigation measures rather than propulsion-specific restrictions.⁵
Post-Accident EV Re-Entry Policy for Multi-Family Garages
48-Hour Precautionary Quarantine Protocol
While propulsion-separated data demonstrate that EV ignition probability is materially lower than that of ICE vehicles¹², lithium-ion battery systems present a distinct operational characteristic: the possibility of delayed thermal runaway following mechanical damage.³
This phenomenon is rare, but documented in post-collision scenarios where battery cell damage results in heat escalation hours after the initial event.³⁴ For multi-family buildings with enclosed parking, the consequence of such an outlier event warrants a structured risk-control policy.
A clearly defined post-accident re-entry protocol can offset this residual risk without restricting compliant EV ownership.
Policy Rationale
The purpose of a quarantine period is not to imply elevated EV fire probability. Instead, it addresses the specific engineering reality that:
Lithium-ion battery damage may not produce immediate visible fire.³
Re-ignition or delayed ignition events have occurred during towing or storage after collisions.⁴
Confined parking structures amplify consequences if ignition occurs.
A short precautionary isolation period substantially reduces the probability that a delayed thermal event occurs inside the structure.
Recommended 48-Hour Quarantine Framework
Trigger Condition:
Any EV involved in a motor vehicle accident, collision with structural elements, undercarriage impact, or flooding event.
Protocol Requirements:
1. No Immediate Garage Re-Entry
The vehicle shall not be parked in an enclosed multi-family garage for a minimum of 48 hours following the incident.
2. Outdoor Isolation Location
During the quarantine period, the vehicle should be parked outdoors in an open-air location:
At least 50 feet from structures when practicable
Away from combustible materials
Not connected to charging equipment
3. No Charging During Quarantine
Charging should not occur until the quarantine period has elapsed and no abnormal heating, odor, or smoke has been observed.
4. Owner Disclosure Requirement
Residents shall notify property management if their EV has been involved in a collision prior to re-entry.
5. Thermal Monitoring Encouraged
Where feasible, a visual inspection for warning indicators (dashboard alerts, battery fault messages, unusual odors, smoke) should be conducted prior to garage return.
6. Professional Inspection for Significant Damage
If battery damage is suspected, re-entry should be conditioned on inspection by a qualified service technician.
Risk Offset Analysis
The 48-hour quarantine window addresses the primary residual EV-specific risk variable: delayed ignition.³
Given that:
EVs are approximately six times less likely to experience fire than ICE vehicles on a per-vehicle basis¹
The majority of EV fires occur proximate to severe damage events³
Delayed ignition, when it occurs, typically manifests within hours rather than days³
A structured quarantine protocol materially reduces the probability of an ignition event occurring inside an enclosed garage.
This approach:
Preserves compliance with right-to-charge statutes
Avoids blanket restrictions on EV ownership
Introduces a narrowly tailored risk control specific to post-damage conditions
Aligns with responder guidance concerning stranded energy and monitoring³ ⁴
Policy Language Example (Board-Ready Draft)
Any battery-electric vehicle involved in a collision, undercarriage impact, or flood exposure shall not re-enter the enclosed parking garage for a minimum of 48 hours following the incident. During this period, the vehicle shall remain parked outdoors and shall not be connected to charging equipment. Re-entry may occur after 48 hours provided no warning indicators, smoke, heat, or battery fault messages are present. The Association reserves the right to require professional inspection documentation if battery damage is suspected.
Addressing a Common Core HOA Concern
Question: Does supporting right-to-charge laws introduce new unaccounted risk to garages?
Evidence-Based Response:
ICE vehicles are approximately six times more likely to experience fire events than EVs in propulsion-separated datasets.¹
EVs incorporate active electrical and thermal monitoring systems mandated by safety standards.³ ⁴
Building fire protection systems are designed to manage generic vehicle fire loads.⁵ ⁶
Right-to-charge statutes require installations to comply with applicable electrical and fire codes.⁵
Supporting right-to-charge laws does not increase overall statistical fire probability beyond that already present from conventional vehicles.
Conclusion
Across the full spectrum of risk assessment for multi-family parking garages, the evidence supports three central findings.
First, the probability of ignition favors battery-electric vehicles. Propulsion-separated national datasets indicate that internal combustion engine vehicles are approximately six times more likely to experience a vehicle fire than EVs on a per-registered-vehicle basis.¹ This establishes a clear statistical asymmetry.
Second, severity characteristics differ but do not fundamentally increase structural fire load. EV fires may involve longer cooling durations and require attention to stranded energy and potential re-ignition, yet full-scale experiments demonstrate comparable total heat release to conventional vehicle fires.⁶ Building-level protections, including sprinkler systems and ventilation, remain the dominant determinants of outcome.⁵
Third, a narrowly tailored 48-hour post-accident quarantine protocol materially offsets the primary residual EV-specific risk variable: delayed thermal runaway following mechanical damage.³ By temporarily restricting re-entry of collision-involved EVs into enclosed garages and requiring outdoor isolation without charging during the observation period, associations reduce the likelihood of a delayed ignition event occurring within the structure.
When considered together:
ICE vehicles present higher statistical fire incidence.¹
EVs incorporate advanced monitoring and isolation safeguards.³ ⁴
Modern building fire protection systems are propulsion-neutral.⁵
A 48-hour quarantine policy further mitigates rare outlier risk.³
From a statistical, engineering, and policy standpoint, permitting EV charging under right-to-charge frameworks does not introduce disproportionate fire risk in multi-family garages. With the addition of a defined post-accident quarantine protocol, any residual EV-specific concern is effectively addressed within a prudent risk management structure.
Sources
¹ Norwegian Directorate for Civil Protection (DSB), Vehicle Fire Statistics (2018–2022).
² Swedish Civil Contingencies Agency (MSB), Vehicle Fire Reports (Electrified Vehicle Incidents).
³ Federal Motor Vehicle Safety Standard (FMVSS) 305 – Electric-Powered Vehicles.
⁴ UNECE Regulation No. 100 – Electric Power Train Safety Requirements.
⁵ National Fire Protection Association (NFPA), Vehicle Fires Report (2018–2022 averages).
⁶ RISE Research Institutes of Sweden, ETOX2 Full-Scale Vehicle Fire Experiments (2024).
⁷ Highway Loss Data Institute (HLDI), Non-Crash Fire Losses for Electric Vehicles.
⁸ Federal Motor Vehicle Safety Standard (FMVSS) 301 – Fuel System Integrity.
⁹ U.S. Fire Administration, Electric Vehicle Fire/Rescue Response Operations (2025).